Unconfigured Ad Widget

Collapse

Real time COVID-19 Indicator Map

Collapse
X
 
  • Time
  • Show
Clear All
new posts
  • smashycrashy
    Veteran Member
    • Sep 2011
    • 2999

    Real time COVID-19 Indicator Map

    Delphi Epidata tracks and forecasts the spread of COVID-19. By Carnegie Mellon's Delphi Research Group.


    FB popped up a survey asking me various COVID-19 questions. I declined to answer but I was curious to see what they did with the data. Turns out it is part of a study where they are trying to detect cases quicker than other data currently (to use mere mortals) available.

    Clicking across the top gets you the various data sets. It appears the flu tests data they get is only in some places not all (they will take a flu test to remove the possibility of the flu in dealing with possible COVID-19 cases), there are surveys for FB & Google as well as Doctors visits.

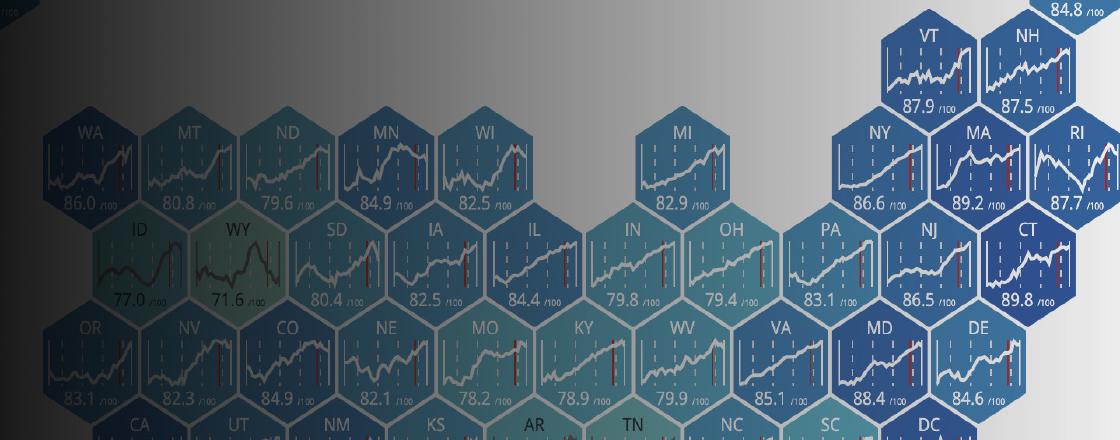
    I think the County level data is most interesting. We will see if it is predictors of new hot spots.
  • #2
    CessnaDriver
    I need a LIFE!!
    • Feb 2009
    • 10633

    Using the slider you can see the map overall starting to lighten towards yellow again. I like the way this data is presented. And I think I may like this particular metric. As other metrics get changed what they include, deaths were getting more inclusive, and more testing means more detections of active cases, this metric I think might stay reliable as indicator.


    "Yeah, like... well, I just want to slap a hippie or two. Maybe even make them get jobs."

    Comment

    Working...
    UA-8071174-1