


|
|
|
|
|
|
|
|
|
 |
|
|||||||
| California 2nd Amend. Political Discussion & Activism Discuss gun rights activism and 2A related political topics here. All advice given is NOT legal counsel. |
 |
|
|
Thread Tools | Display Modes |
|
#1
 12-29-2009, 6:29 AM
|
||||
|
||||
|
This was posted in another thread, but thought I'd start a new one.
This chart shows a comparison of Gun Laws & Violent Crime Stats for each state. The Green line indicates # of violent crimes per 2,000,000 people. (higher number = higher crime rate) Data collected here. The Blue line indicates Brady Bunch state rating. (higher number = more gun control) Data collected here. BTW - I gave D.C. the same Brady score as CA, for comparison purposes. 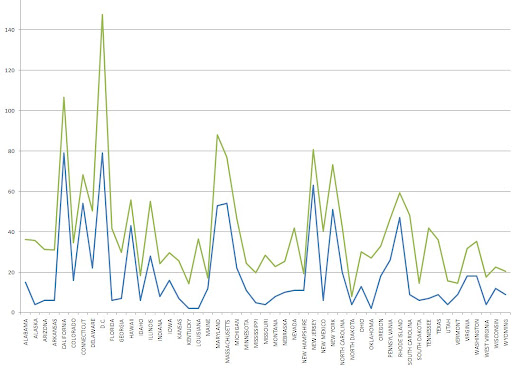 Coincidence? I think not. 
|
|
#2
12-29-2009, 11:26 AM
|
||||
|
||||
|
As much as I would like to agree with you on the correlation, there is none there...
The problem here is in source data that has numbers from large states like CA or TX and small ones like RI put together into a single table given same level of significance. Also "average" crime rate is not a very useful number for anything. What does it mean to have "average" crime rate between Oakland or Richmond and safe rich cities like Los Altos or Palo Alto? There is no meaning for any of this. Brady's score has nothing to do with science either so there is no point to try playing statistics to get numbers that we like. This is not a good game because it can be played any way you want or Brady wants. So if you will try to give it some sort of "scientific legitimacy", keep in mind that other side will use it too..
__________________
Democracy is two wolves and a lamb voting on what to have for lunch. Liberty is a well-armed lamb contesting the vote. Benjamin Franklin (1706-1790) 
|
|
#3
12-29-2009, 11:38 AM
|
||||
|
||||
|
But, it is interesting to see that violent crime per capita is higher in those states that the Brady's deem as 'safer' due to having more restrictive gun laws.
Of course the data isn't perfect - it's coming from the Brady's and Wikipedia - not the most reliable sources - but nonetheless, it's still interesting...at least to me. The fact the the data sets came from completely different sources, and the lines are nearly parallel tells me that there is some significance to it, and it's not just coincidence. Last edited by Chris M; 12-29-2009 at 11:41 AM..
|
|
#4
12-29-2009, 11:42 AM
|
||||
|
||||
|
Without law genesis dates, it's hard to use that graph in a positive way. Couldn't it read that those areas with higher crime have more strict gun laws due to the efforts to reduce already high crime rates? Chicken and egg thing without the dates.
|
|
#5
12-29-2009, 11:58 AM
|
|||
|
|||
|
I think someone could also argue that the reason there are so many gun laws in the higher crime rate states, is because of the crime rates.
So is it that the crime rate is so high in California because of the gun laws, or are there all these gun laws in California because of the crime rates? There is really no good information on a coloration between tough gun laws and crime rates. It is apparently a difficult thing to normalize the data with so many factors involved. Are the Police doing something different in how they investigate? Are there less murders because the medical technology is keeping more people alive now? Are the gun laws working? Does the diversity of California lead to more gun crimes then say, North Dakota? Maybe the bad guys would rather steal your stuff in sunny Los Angeles, then snowy Fargo? Who knows? But I don't think abridging a constitutional right to run an experiment is really a great idea.
|
|
#7
12-29-2009, 12:18 PM
|
||||
|
||||
|
I think what the chart shows is that the Brady scores are the cause of all crime, and they should be banned by name...
-madmike.
__________________
-madmike. I would like to say something profound here...
|
|
#8
12-29-2009, 12:57 PM
|
||||
|
||||
|
This may show that places with higher crime rates tend to be more open to vilifying gun ownership for whatever causes.
-Gene
__________________
Gene Hoffman Chairman, California Gun Rights Foundation DONATE NOW to support the rights of California gun owners. Follow @cgfgunrights on Twitter. Opinions posted in this account are my own and not the approved position of any organization. I read PMs. But, if you need a response, include an email address or email me directly! "The problem with being a gun rights supporter is that the left hates guns and the right hates rights." -Anon
")
|
|
#9
12-29-2009, 8:19 PM
|
||||
|
||||
|
Chris M - I think your analysis is good for discussion, especially among the unconverted. When I talk with my co-workers this would be an ideal topic; not because it answers every nuance of the relationship between firearms, crime and gun control, but because it casts the argument in a way that can be easily communicated and discussed over lunch (which is the length of time I have to make my arguments).
No, it will not stand up to publication standards of peer reviewed academic journals. However I would argue that half of the laws passed in this county use less evidence to support their passage than you provided. Don't let the criticisms of other posters, no matter how appropriate, discourage you from pursuing this line of thinking. Keep building on your ideas using the observations from the responses to your post. I like your thinking.
|
|
#10
12-31-2009, 4:52 PM
|
||||
|
||||
|
Quote:
I'm trying to reproduce the results, and am having a hard time duplicating them with the data from the referenced Wikipedia entry. Thanks very much.
|
|
#11
12-31-2009, 5:05 PM
|
||||
|
||||
|
Quote:
__________________
Look at the tyranny of party -- at what is called party allegiance, party loyalty -- a snare invented by designing men for selfish purposes -- and which turns voters into chattles, slaves, rabbits, and all the while their masters, and they themselves are shouting rubbish about liberty, independence, freedom of opinion, freedom of speech, honestly unconscious of the fantastic contradiction... Mark Twain 
|
|
#12
12-31-2009, 6:25 PM
|
||||
|
||||
|
Quote:
Basically, I was trying to adjust the ratio, in order make the numbers in the wiki more level with the numbers in the Brady scores. For instance 500 violent crimes per 100,000 = 50 crimes per 10,000. The Brady's scoring system is 0-100...I wanted to adjust the ratio so that the majority of the crime data fell within that range.
|
|
#13
03-04-2010, 12:30 AM
|
||||
|
||||
|
Quote:
But stating that wouldn't be using their tactics against them. 
__________________
Possession of high capacity magazine is NOT illegal. CAL. PEN. CODE § 12020 If you search and cannot find a thread about it, search again using This Search Gun Facts PDF
|
|
#14
03-05-2010, 8:17 AM
|
|||
|
|||
|
I took the FBI's violent crime numbers for years 1999-2008 and the brady campaign's state ratings and was unable to reproduce his original graph. But with all the data at hand wanted to see what I could take from it. Going forward with the thought train that if gun legislation did work then a state with a high rating should have a low violent crime rate. So if you took the difference and the results was negative that would show that increased gun regulation has a corresponding lower violent crime rate. If it is positive then it shows that additional gun legislation does not lower the violent crime rate. You average all the differences to find the overall trend for the nation.
The algorithm is such: State Violent Crime Rate per 100,000 = (State's Total Violent Crime Incidents x 100,000)/State's Population. Normalize both the State Violent Crime Rates and brady campaign state ratings: Normalized Data = (Data-Min(Data))/(Max(Data)-Min(Data)) Now both sets of data range from 0 to 1 so you can do a direct comparsion, i.e. apples to apples. Difference = Normalized State Violent Crime Rates - Normalized brady campaign state ratings If (Difference)<0 then gun legislation does lower the violent crime rate If (Difference)>0 then gun legislation does NOT lower the violent crime rate. To find the overall trend for the nation you do the arithmetic mean to compute the "average": Mean Differences = Sum(Differences)/50 [Number of States] If (Mean Differences)<0 then the overall trend for the nation is that gun legislation does lower the violent crime rate. If (Mean Differences)>0 then the overall trend for the nation is that gun legilsation does NOT lower the violent crime rate. I computed graphs for all the years I could get data for, 1999-2008. And the overall trend for each year was positive therefore showing that additional gun legislation does NOT lower the violent crime rate.
|
|
#15
03-05-2010, 8:20 AM
|
|||
|
|||
|
Graphs for years 2004-2008.
|
|
#16
03-05-2010, 8:47 AM
|
||||
|
||||
|
Quote:
__________________

|
|
#17
03-05-2010, 9:01 AM
|
|||
|
|||
|
Graphically, I think a double bar graph for each state would work better for the OPs table than a continuous line graph. There is no reason to link the data points from different states.
Nit has been picked...  Tim
|
|
#18
03-05-2010, 9:13 AM
|
||||
|
||||
|
There is an article similar to this from one of the Gun Rights Examiners. The correlation is pretty solid. The more violence there is in a state, the higher the Brady bunch rates the state for the gun control that gave way to the violence.
|
|
#19
03-05-2010, 9:24 AM
|
||||
|
||||
|
Quote:
I think the word you were looking for was "causation."
|
|
#20
03-05-2010, 9:28 AM
|
||||
|
||||
|
I think this says it all

__________________
 Most civilization is based on cowardice. It's so easy to civilize by teaching cowardice. You water down the standards which would lead to bravery. You restrain the will. You regulate the appetites. You fence in the horizons. You make a law for every movement. You deny the existence of chaos. You teach even the children to breathe slowly. You tame. People Should Not Be Afraid Of Their Governments, Governments Should Be Afraid Of Their People ΜΟΛΩΝ ΛΑΒΕ
|
|
#21
03-05-2010, 10:27 AM
|
||||
|
||||
|
Same Data as OP arranged by Brady Campaign score (High to Low). D.C. is rated a 95 in this data set based on estimates of their scoring criteria. The Brady's do not score D.C. I don't need to do a statistical test to see that there is no correlation between Brady Campaign scores and violent crime rates.

__________________
|
|
#23
03-05-2010, 11:15 AM
|
||||
|
||||
|
__________________
www.yaliberty.org I love America more than any other country in this world, and, exactly for this reason, I insist on the right to criticize her perpetually -James A. Baldwin
|
|
#24
03-05-2010, 11:23 AM
|
||||
|
||||
|
|
|
#25
03-05-2010, 11:29 AM
|
||||
|
||||
|
I think a scatter plot of brady rating vs violent crime rate (omitting the states) would be more useful. Can somebody post a .csv of the data used in post 21?
|
|
#26
03-05-2010, 11:37 AM
|
|||
|
|||
|
Very nice graph- thank you.
Would not mind seeing the inverse graph: order the states by violent crime rate and then add the Brady data points. tim Quote:
|
|
#27
03-05-2010, 11:40 AM
|
||||
|
||||
|
I love Calgunners.....

__________________
Rest in Peace - Andrew Breitbart. A true student of Alinsky. 90% of winning is simply showing up. "Let's not lose sight of how much we reduced our carbon footprint by telecommuting this protest." 383green  NRA Benefactor Member
|
|
#28
03-05-2010, 11:58 AM
|
|||
|
|||
|
Quote:
Violent Crime Rate per 100,000 = State's Violent Crime Incidents * (100,000/State's Population). This will therefore allow the different states to be compared allowing the large differences in each state's population. I.e. a Apples to Apples comparsion. Median Income is not included in any FBI's datasets I've seen. Also you shouldn't use data outside collected the two datasets used because your not sure how the data was collected and if you can properly compare and contrast the different datasets. You can use outside data, but that then requires additional number crunching and that usually goes beyond my comfort zone of how much massaging of the data is allowed and the numbers to actually be true. Last edited by racer98765; 03-05-2010 at 12:03 PM..
|
|
#29
03-05-2010, 12:02 PM
|
||||
|
||||
|
Quote:
__________________
|
|
#31
03-05-2010, 2:02 PM
|
||||
|
||||
|
A scatter plot of brady (x) vs all the rest of that last plot (y) (correlate by state) would be awesome!
|
|
#32
03-05-2010, 2:21 PM
|
||||
|
||||
|
Quote:

__________________
|
|
#33
03-05-2010, 2:28 PM
|
||||
|
||||
|
ROFL! It just doesn't get any better than that. Thanks kap!
|
|
#34
03-05-2010, 2:54 PM
|
||||
|
||||
|
Alrighty - explain it to someone who had to take Stats a couple times.....
__________________
Rest in Peace - Andrew Breitbart. A true student of Alinsky. 90% of winning is simply showing up. "Let's not lose sight of how much we reduced our carbon footprint by telecommuting this protest." 383green NRA Benefactor Member
|
|
#35
03-05-2010, 4:14 PM
|
||||
|
||||
|
Quote:
To be fair, the linear trendline is not a great fit for this data, but does give you a general idea of what is going on. If gun laws actually helped reduce violent crime you should see violent crime decrease as gun laws increase (i.e. the line would slant downward from left to right instead of upward). The take home message is that more gun laws (High Brady Score) do not correlate with a decrease in violent crime.
__________________
|
|
#36
03-05-2010, 10:39 PM
|
||||
|
||||
|
I believe the answer to the question in the thread title is; Yes, there is a link. More gun crontrol = more crime. Generally speaking.
|
|
#37
03-05-2010, 10:49 PM
|
||||
|
||||
|
Quote:
true, but does it not also anecdotally mitigate the contention that restricting guns lowers crime... and to be fair, our antagonists have used far more questionable examples to buttress their position Quote:
__________________
We’re ALL GOING TO DIE! Can’t somebody do something?!?!?!?! Last edited by five.five-six; 03-05-2010 at 10:52 PM..
|
|
#38
03-05-2010, 11:47 PM
|
||||
|
||||
|
Quote:
Back data would be great, so would p-values. It's all a matter of time invested and what it would accomplish.
__________________
|
|
#39
03-06-2010, 7:11 AM
|
||||
|
||||
|
I stumbled across this website last week and found this interesting:
http://www.statemaster.com/correlati...te-per-100-000 It shows the factors that correlate most with the firerarm deaths per capita. So between the factors they track the statistic about reading and writing levels correlates the most.
|
|
#40
03-06-2010, 8:14 AM
|
||||
|
||||
|
Quote:
no, you are missing th point... the high brady scores would be on the left (or right) and be descending (or ascending) if you are going to use questionable data correlations to change world opinion, learn from the masters back data, shmack data, just make up data that fits your conclusion, it's just as good
__________________
We’re ALL GOING TO DIE! Can’t somebody do something?!?!?!?!
|
|
| Thread Tools | |
| Display Modes | |
|
|
 |
 |
 |


 Linear Mode

